

The 2017 edition of venture capitalist Mary Meeker’s annual Internet Trends report was published last week.
As with previous editions, the 2017 report offers credible insights into some of the significant trends that are shaping, evolving and defining the internet and our use of it. This year, there’s a strong focus on online advertising, interactive games, healthcare, and much more.
Weighing in at 355 slides, the presentation deck PDF is a hefty opus with much to glean and digest. I’ve zeroed-in on some metrics that offer insights of particular interest to communicators like me. Following my narrative, in which I note the numbers of the specific slides that I’m highlighting, I’ve embedded Meeker’s deck so you can view or download all those slides right here.
While many of the specific examples I’ve highlighted are from experiences in the USA, it’s fair to consider them as broad trend indicators and pointers that would also be indicative for other markets such as the UK, continental Europe and further afield. Indeed, the report goes into some detail on trends in two specific countries – India and China.
So let’s get to it…
1. Internet users totalled 3.4 billion people worldwide in mid-2016, growth of 10% over 2015. Overall year-on-year growth since 2010 is on a gradual decline, though. (Slide 6)
2. Global smartphone shipments continue to slow dramatically: just 3% growth in 2016 compared to 70+% in 2010. Android remains the dominant mobile OS at over 80% with Apple’s iOS less than 20%. ‘Other’ (including Windows Phone, Blackberry) continue diminishing year on year. (Slide 7)
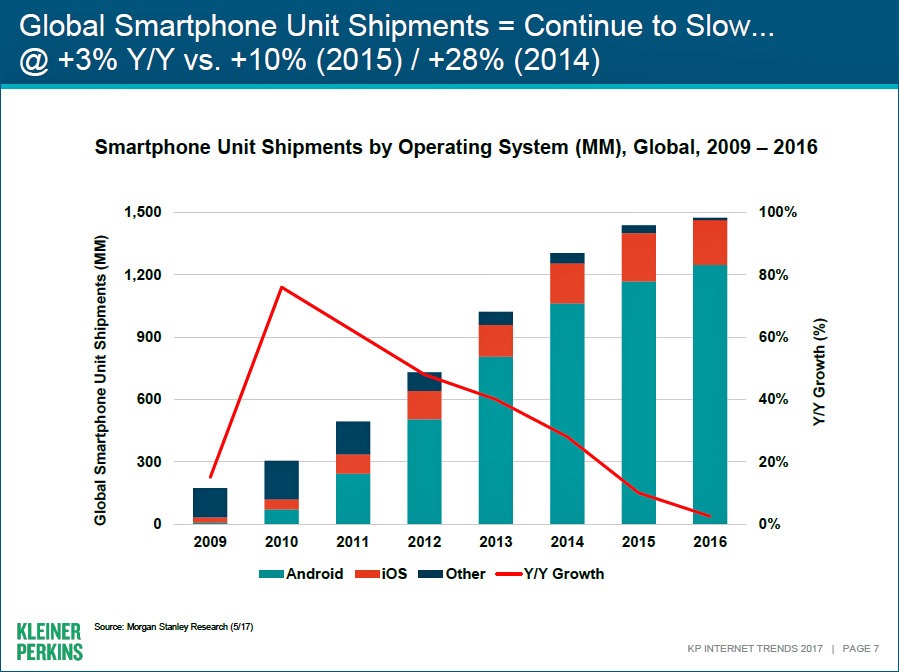
- My take: markets are saturated with choice and volume, there’s consumer decline in upgrading every time a new model appears, and prices/total cost of ownership are perceived as being too high.
3. Online advertising will exceed television advertising on a global level in 2017. (Slide 14)
4. Google and Facebook together accounted for 85% of total online advertising revenue growth between 2015 and 2016. (Slide 15)
5. ‘Engagement’ is the prime metric used to measure success for 56% of social advertisers. But measuring actual ROI is the prime challenge for 61% of advertisers in social media marketing. (Slide 17)
6. Ad blocking is on an inexorable increase especially on mobile devices in developing countries. From its appearance in 2009, ad blocking software on the desktop gradually grew to well over 200 million users in 2016. But ad blocking software on mobile devices, which took off only in 2014, reached nearly 400 million users in 2016. (Slide 18)
There are clear contrasts in market penetration on desktops vs mobile: for instance, 28% on desktops in Germany vs 1% on mobile; 24% and 0% respectively in Canada; 18% and 1% in USA; 16% and 1% in the UK. In contrast, Indonesia shows 8% on desktops and 58% on mobile; in India, 1% and 28% respectively; and in China, 1% and 13%.

- My take: the ad blocking war is moving to mobile, probably a factor in recent initiatives by advertisers and publishers to clean up their act, and moves by Google to include ad blocking functionality in the Chrome browser soon (it’s already in browsers like Opera).
7. Images and voice can replace typing words in online search, especially with the advent of voice-activated consumer technologies such as Amazon Echo. (Slide 43, 46, 47)
8. Voice recognition word accuracy rate reached 95% in May 2017 compared to 90% in 2016. (Slide 48)

- My take: This is a huge advance in machine learning capability where the holy grail of 99% accuracy could be within reach in only a few years. Meeker included a perceptive view on the significance of 99% on slide 117 in her 2016 report, quoting Andrew Ng, former Chief Scientist at Baidu: “Most people underestimate the difference between 95% and 99% accuracy – 99% is a game-changer.”
9. Social media can drive accountability: in 2016, 82% of customers stopped doing business with a company after a bad experience, up from 76% in 2014 – and talked about it on social networks. (Slide 54)
10. The unboxing experience, with videos posted to YouTube, is fast becoming a broader brand/product entertainment experience. (Slide 67)
11. Grocery shopping is getting fast, personal and easy with retailer Instacart showing 85% of in-store product replacement options suggested by algorithms. (Slide 69)
12. Online gaming tools can optimise learning and engagement: solving puzzles, planning workflows, completing projects, competing, following rules, collaborating/interacting with others, and more. (Slide 88)
13. Gameplay provides opportunities for self-optimisation driven by statistics, metrics and rankings. (Slide 101).
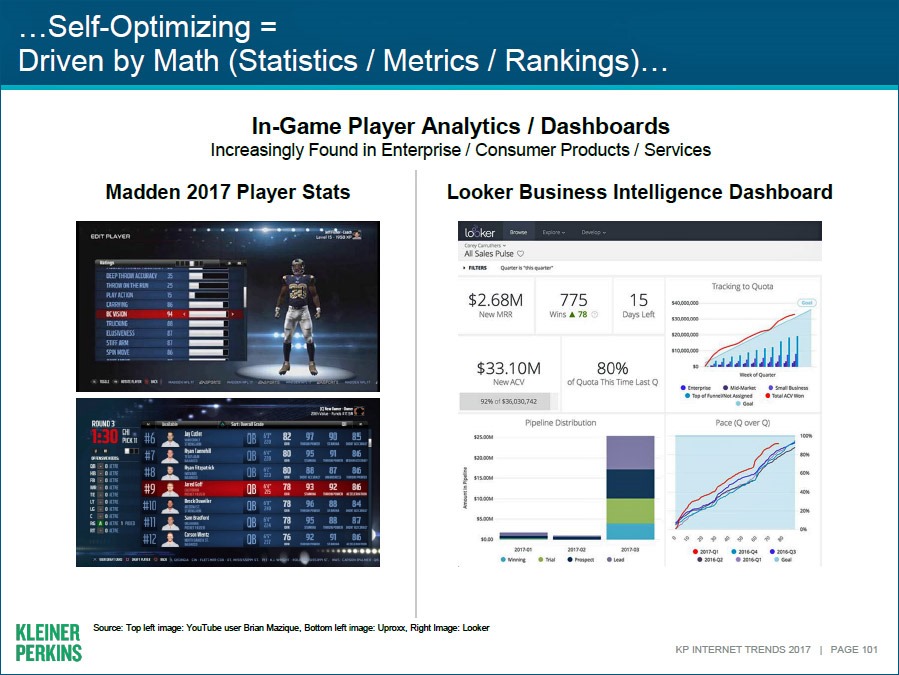
- My take: the obvious benefits of competitive gameplay are complemented by in-game player/team analytics capabilities and dashboards to access play data, providing players with easy introductions to data analytics tools and insights-gleaning and visualisation that will fast-track their skills and confidence to do the same in the workplace using visual enterprise data analytics tools.
14. Video gaming is the most engaging form of social media with social networks Facebook, Snapchat and Instagram three of the top five platforms, each of them strong on mobile. It’s notable that Facebook owns Instagram, giving Facebook a commanding overall position in 2017. (Slide 114)
15. Gaming platforms are evolving at high speed to build ever more immersive virtual worlds. Second Life was way ahead of its time. (Slide 135)
16. Netflix streaming: from zero to 30% of US home entertainment revenue in just ten years. (Slide 162)
17. Mobile ‘generation chasm’: the younger you are, the more digital you are. (Slide 171)

- My take: such metrics continue the trend that’s featured in Meeker’s reports in each of the past few years. What’s illustrative is that the ‘generation chasm’ is increasing as shifts to spending time on internet-enabled (digital) media on mobile continue.
18. With enterprise software, employees expect products to be as well designed, easy to use and as reliable as consumer applications. (Slide 187)
19. Healthcare is at a digital inflection point, with three distinct evolutionary phases during the past 100 years – human touch > machine assisted / analogue > technology enabled / digital. (Slide 289)
20. Consumers increasingly expect digital health services, especially Millennials. (Slide 308)
There is a great deal more insights to glean from all the 355 slides in Mary Meeker’s Internet Report 2017. You may have different focuses than those I’ve illustrated here.
Either way, the picture we can see from such trends will help inform our opinions and the plans we make for our own places in this rapidly-changing landscape.
You can view the report here (embed below) or download it from the KPCB website.
Internet Trends Report 2017 from Kleiner Perkins Caufield & Byers by Neville Hobson on Scribd